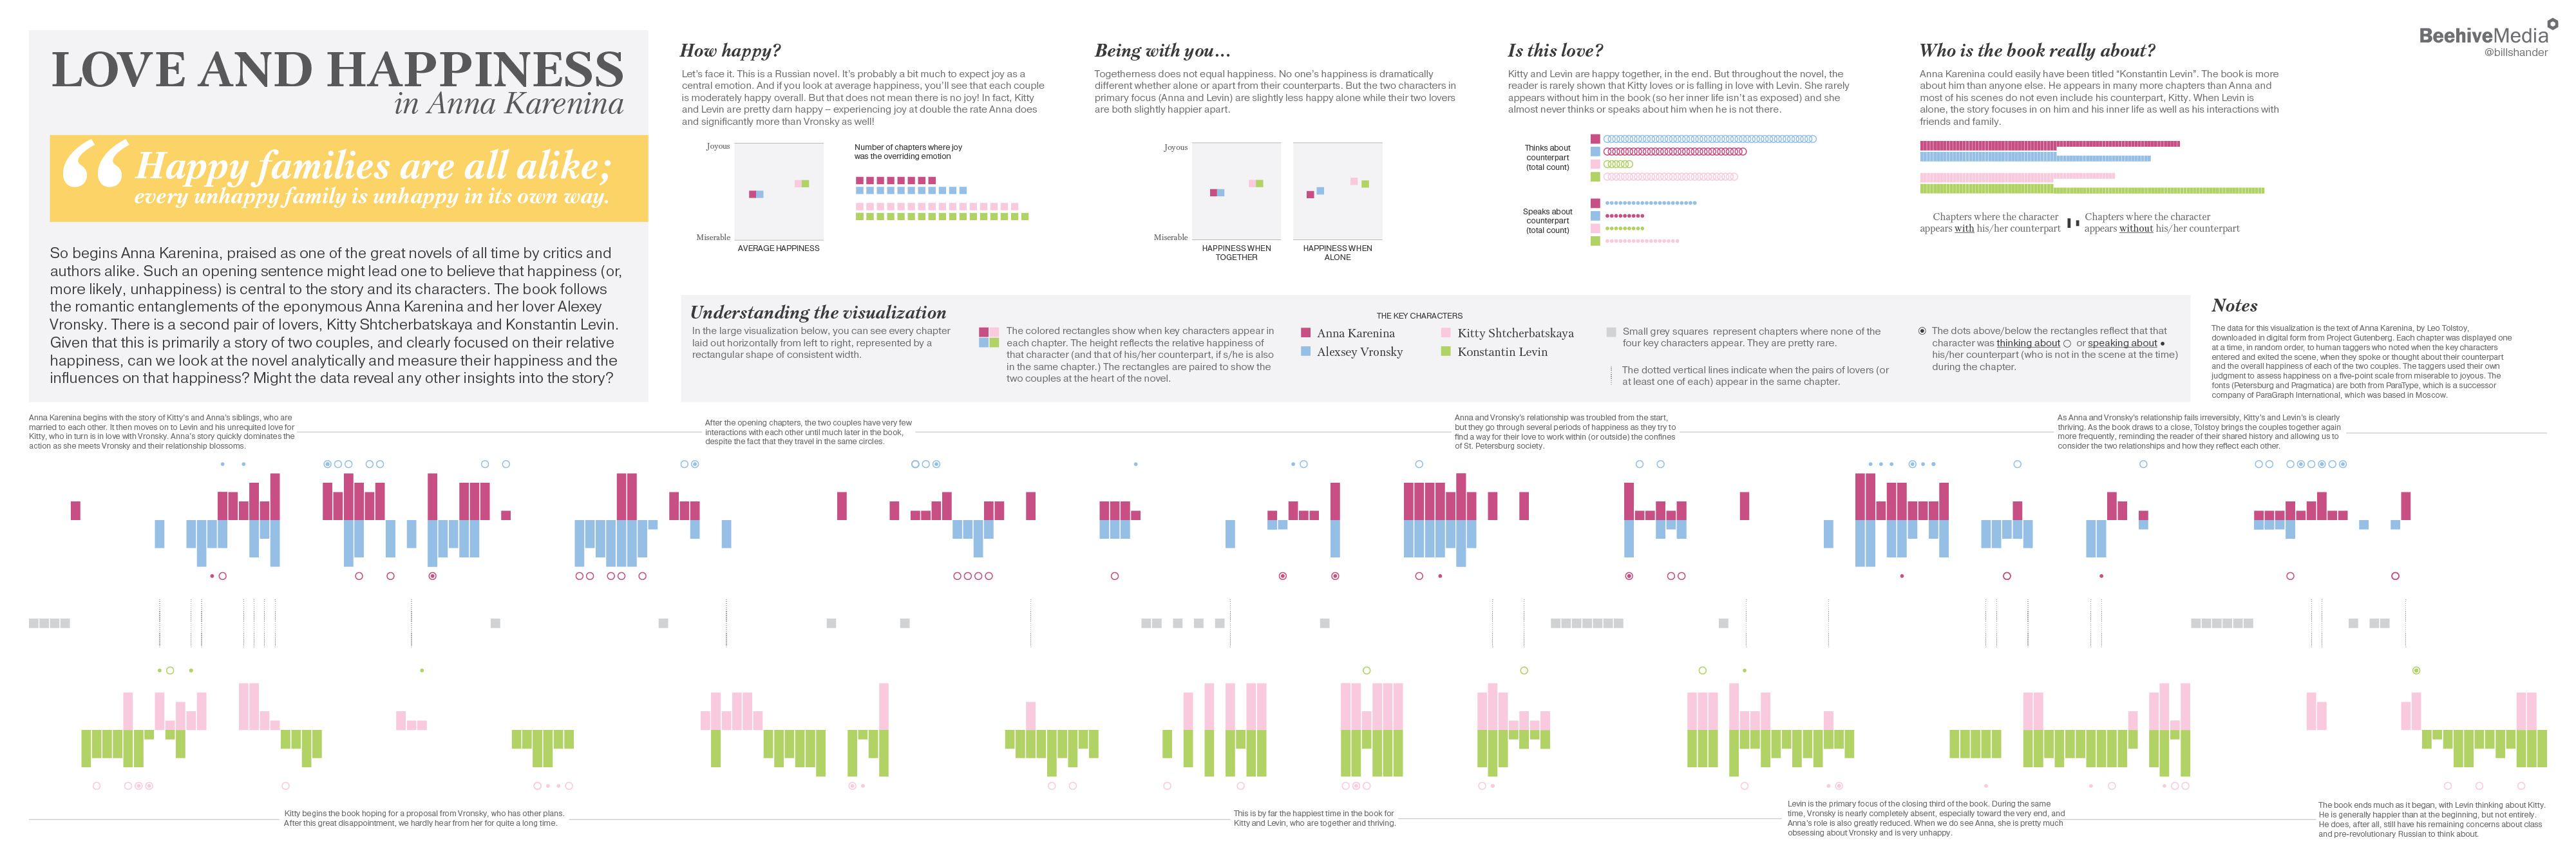
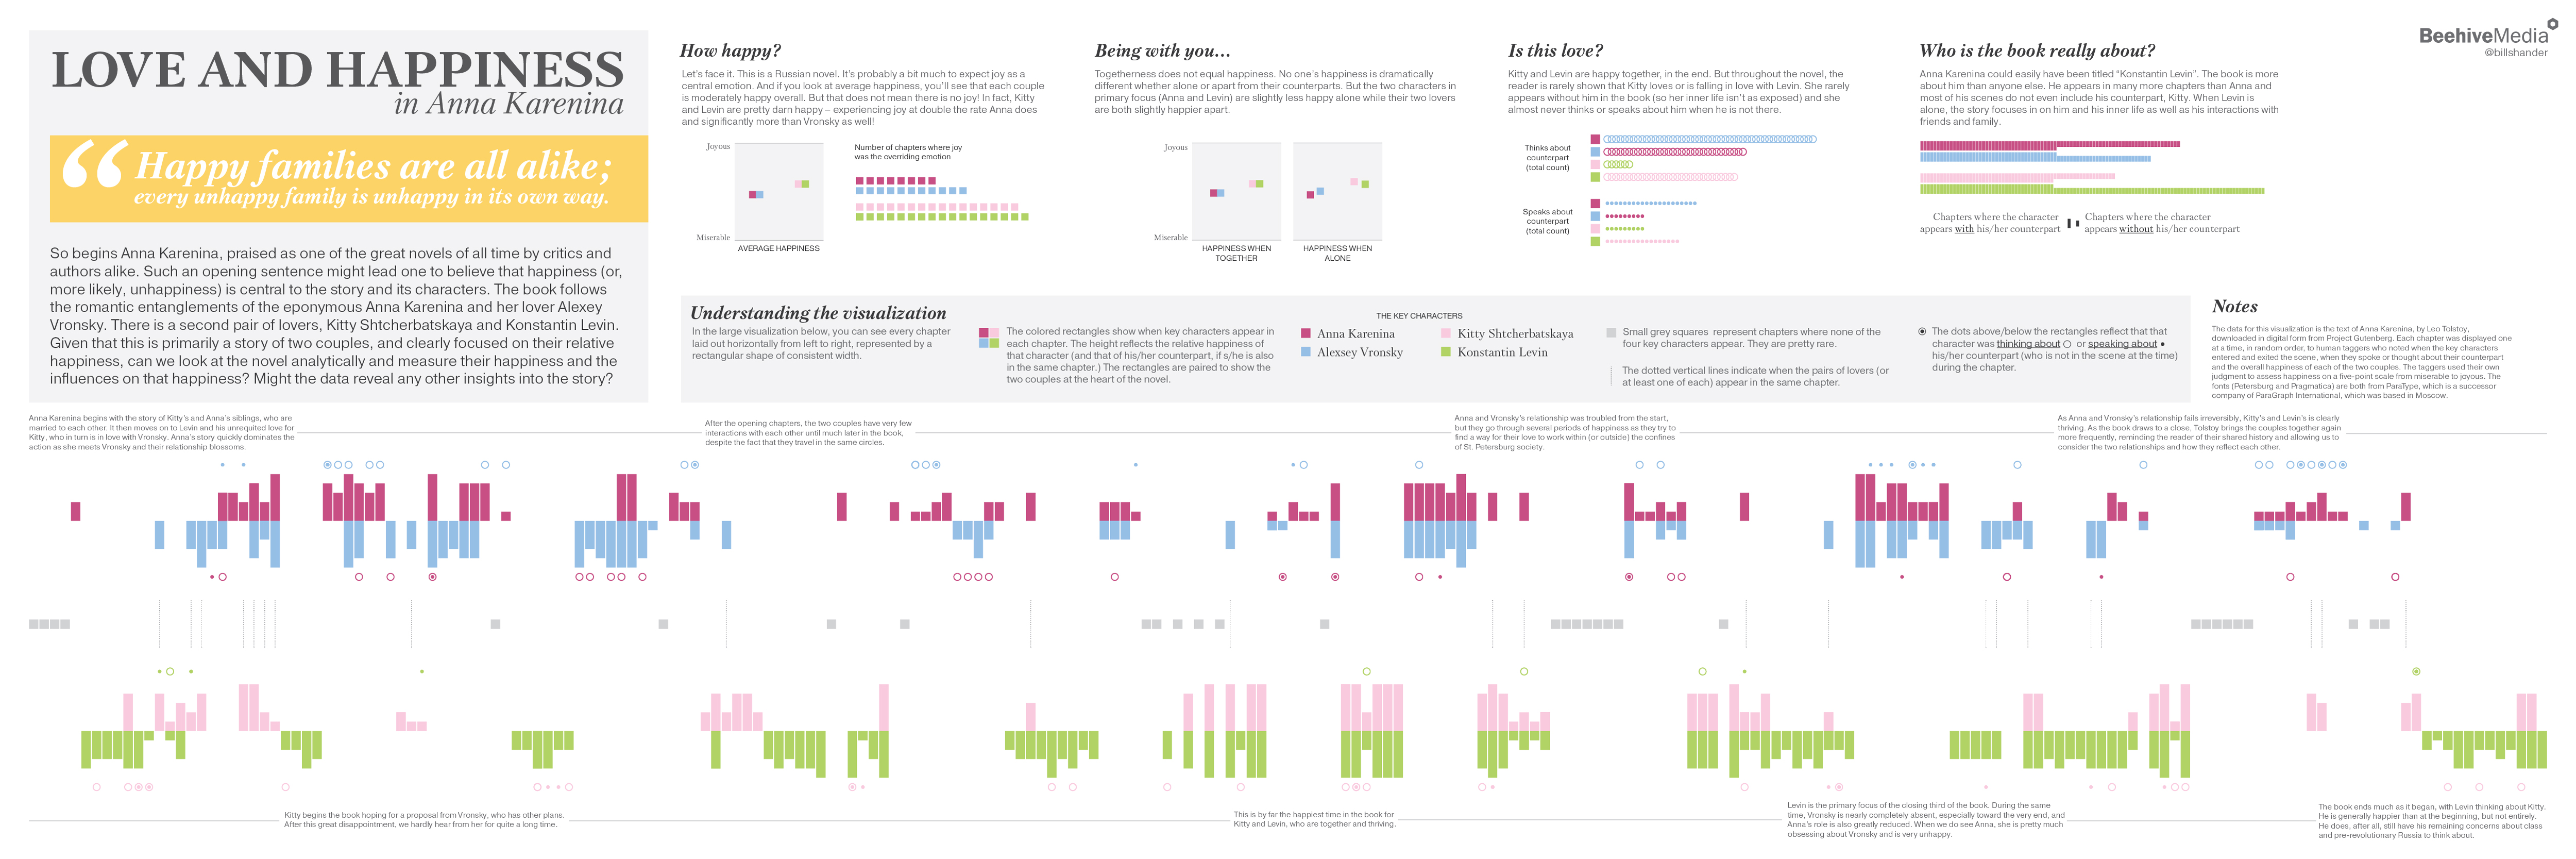
“Happy families are all alike; every unhappy family is unhappy in its own way.”
When you start a novel with a sentence like that, you’re broadcasting a message to your readers that your book is going to focus in on the happiness (or the lack thereof) if its characters. Anna Karenina, by Leo Tolstoy, is known to be a love story, of course. So we can assume that love and happiness are at the heart of the book.
I read it last year for the first time and as I was reading it, I was thinking a lot about love and happiness and how those two emotions played out for the different characters. I formed my own opinions and understandings of what Tolstoy was trying to say. But, being an information designer, I wanted to test my thinking against the data of the book. So I set out to create a visualization that could summarize the data on this topic. In this post, I will explain the steps I took to create the visualization, which you can see below. It was designed as a 36″ X 12″ poster, which you can purchase, if you like it!
The Data
Step one in any project like this is getting the data. I downloaded a copy of the book from Project Gutenberg, which is an amazing resource that I highly recommend. You can download thousands of copyright-free books in multiple formats for work or pleasure. I downloaded the plain text file, which is the easiest kind of file to work with for this kind of work, I think. The downside is that the plain text file has a lot of junk in it that has to be cut out before you can work with the book content itself. For instance, it starts with the title and an introduction of sorts to Project Gutenberg and some metadata. The end of the book has an even longer collection of text, such as the full Project Gutenberg License, which describes what you can and can’t do with the text.
Converting the Data
As anyone who has worked in data visualization well knows, your data is NEVER in the form you need it in to do what you want to do. A raw text file is a perfect example. I needed to convert this raw unstructured data into structured data so I could apply some logic to it. In order to convert the book into structured data, first I had to figure out how I was going to evaluate the data. You need to know your plan before you can execute, right?
I knew that I wanted to investigate happiness and specifically wanted to look into character proximity and happiness. Are the key characters happier when together with their lover or not? This is a fundamental question in a story like Anna Karenina. It is equally as fundamental to understand that while the book is titled Anna Karenina, and it is largely about her and her lover, Vronsky, there is another equally as important couple, Levin and Kitty. Their narratives are all intertwined and the two couples cross paths here and there but are clearly juxtaposed and meant to be compared. So this was an important idea to analyze as well – comparing the two couples’ happiness and the influences on their happiness.
My first idea was that I was going to take a shot at doing computer-driven text analysis. I was planning on brushing up on my Python and Natural Language Toolkit (NLTK) skills. NLTK is a Python library with an amazing collection of built-in features for processing and analyzing text. So I just started writing some Python scripts. First, I split the book into chapters, then into words.

Then I examined the words and tracked when the key characters entered and exited the scenes to programmatically determine when characters were in scenes together. Not being a text analysis wizard, I found it challenging to come up with an algorithm to determine whether characters are in the same scene. It’s not just when their names appear (someone could be talking about them) but it’s also not just when you see [character][noun]. And given the classic problem of a Russian novel with many variations of names and characters that share names and a few other challenges, I was unsure how my character proximity tracker was working. So I wrote a script to score them based on my confidence and saved them out to a comma-delimited-file, which I then went through manually and for all of the low-scoring items, I checked them manually to be sure the characters were really there!
Then I started to play with sentiment analysis using NLTK and then using an outside API. But I found that my NLTK skills weren’t up to snuff and/or the overall sentiment analysis wasn’t returning specific enough information. I was getting the overall sentiment in a chapter, but that wasn’t telling me how happy Anna and Vronsky are as compared to others in the scene, for instance.
So I gave up! (It’s important to know when to quit in any project. I knew what was working on wasn’t going to do the trick so I abandoned the many dozens of hours of work I had invested in NLTK. Oh well….) I dropped the project entirely, in fact, for about 3 months. Then one day I was compelled to return to it, as happens sometimes. But I needed a new plan.
First, I was going to use Mechanical Turk to get human taggers to notate the data I wanted but I was concerned that the language skills may not be up to snuff, given the complexity of a Russian novel, translated into English. And because Mechanical Turk is very regimented. You can do certain things like work in spreadsheets, etc., but I couldn’t easily do what I wanted, which was to get people to use a custom tool I decided to build to tag the content.
Yes, next I built a tagging website!
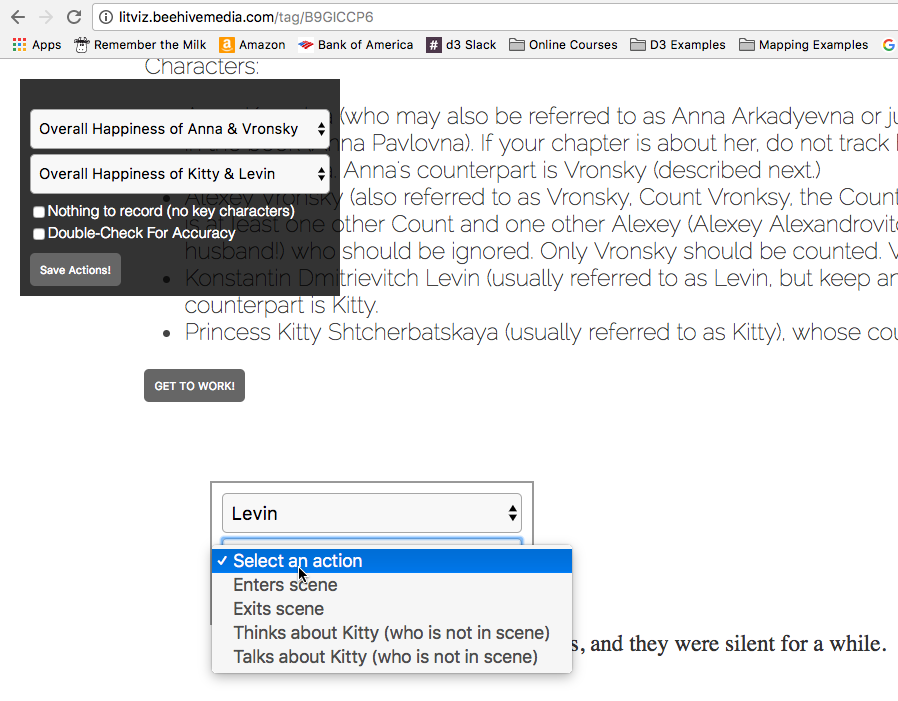
This involved salvaging at least a little of my Python work, because I had to get the chapters of the text I had previously split up into a database. I then hired a handful of people on PeoplePerHour.com and gave them detailed instructions to tag one chapter at a time. Each person was given a dozen or up to a few dozen chapters, in random order, to tag. They just went to the randomized links I sent them, clicked character names, noted when they entered/exited the scene and/or thought/spoke about their lover. And they noted the overall happiness of the couple in that chapter. This site was built in Laravel Framework, and captured the data to a MySQL database. (Another reason I decided to put this level of effort in is that now I have the logic for a tagging engine, which could come in handy for other projects!)
After just a few days, I had a collection of structured data! While the data is subjective and limited (and could have benefitted from a dozen people rating each chapter so I could get an average rating, rather than one persons’ judgment), I did manually spot-check a bunch of the chapters and they seemed to be well-done and in line with what I would have expected.
Design
I had data, so it was time to design my infographic. As I always say, you have to sketch out your ideas when you’re designing with data. Nothing works better than your hands. I started sketching on whiteboards and my trusty notebook.

In the interest of full transparency, I’m including the last sketch I did in my notebook. As you will see when you compare the sketch with the final output, there is almost nothing in common with the sketch and the final design! And that’s OK! My sketches start my thinking. Sometimes what I create is a direct reflection of the sketch. Other times, I will riff. Often once you’re in production mode, the data itself will show you how poorly your design ideas really work. One thing I will say is that I frequently do very significant and quality-improving design work in code or digital design/production. Don’t get hung up on your sketches, but sketch every single time to get your ideas flowing. (FWIW, while this is the last full collected sketch I created, I did create many interim sketches on whiteboards while in production mode – testing ideas quickly before coding them to be sure I could capture what was in my mind before bothering writing code.)
Production
Initially, my plan was to use Adobe Illustrator Scripting (AIS) to generate the visualization for this project. But I was finding it a bit difficult to do some of the things I wanted to do. I’m in the middle of creating a course teaching AIS, which is an amazing technology, by the way (sign up for my email list above and I’ll let you know when the course launches!) But AIS can be a bit cumbersome when there is a lot of data and/or you’re not quite sure what you want to do yet. So after writing some initial scripts, I dropped that idea too and moved on to D3.
D3 is a javascript library for creating interactive data visualizations. I had no plans to make an interactive piece. I was always planning on creating a large static image in Adobe Illustrator for this project. But there is a fantastic tool called SVG Crowbar which will allow you to download any SVG graphics from a webpage. D3 generates SVG files and Illustrator can open and work with SVG so…I was in business!
Remember when I said your data is never in the form you want it? Even though I had created a tagging engine and had structured data, it still wasn’t what I needed to do exactly what I wanted to do. It was raw tagging information. I had a table in a MySQL database, with one row each for happiness level for each chapter and couple, one row each in another table for when each character entered/exited a chapter, and so on. My first D3 script simply went through these various tables of data and collected them into a large array organized by chapter that I could then iterate through to generate my chapter-driven design. Because by this point, I knew I wanted to have one strip for every chapter and I would display different information depending on whether the key characters appeared, how happy they were, etc.
I also wanted to do some summary visualizations as part of the infographic, so while my D3 script was calculating the large array, it also captured some of the aggregate data I needed for those other bits.
Then I used D3 to generate the large visualization that dominates the graphic. I built this in pieces – first the rectangles displaying the chapters and key characters and their relative happiness. This was the part that took the longest because I was trying many different visual approaches, starting with my sketch ideas, then abandoning those, and moving on to newer ideas. The main challenge was showing the two couples in a way that it was easy to see the relative happiness of the individual characters, as well as the couples as a whole, and having them related to each other yet separate. And I had to find a way to include showing when the key characters were thinking/speaking about their counterparts without overwhelming or confusing the eye.
Once I had the main graphic pretty much working, I downloaded the SVG file and brought it into Illustrator and manually adjusted it for hours and hours, while adding all of the typography and smaller visualizations by hand. The only other thing I generated automatically in D3 were the average happiness visualizations – I wanted to be sure that those little squares were in exactly the right spot based on the relative happiness scores.
Conclusion
This kind of project takes a very long time. I worked in multiple technologies, created many different kinds of scripts, automated some processes, worked meticulously and manually on others, and carefully curated and wrote just the content and tight story line that focused in on what I wanted to talk about. I did not track my time on this project but I would estimate it took at least 100 hours, possibly more like 150+.
I hope this play by play explanation of what I did is helpful and interesting. And, more importantly, I hope you like the infographic!