2016 is going to be big.
I think this year is going to feel sort of like we are at “peak data visualization”, though I don’t think we are. This will be an important watershed moment for the field in many ways due, in large part, because it is exploding on many fronts (in a good way.) Assuming I’m right, what does it mean to those of us who are practicing in the industry? What does it mean for the rest of the world (consumers of our work, hirers of our talent, data practitioners, etc.) I have some ideas.
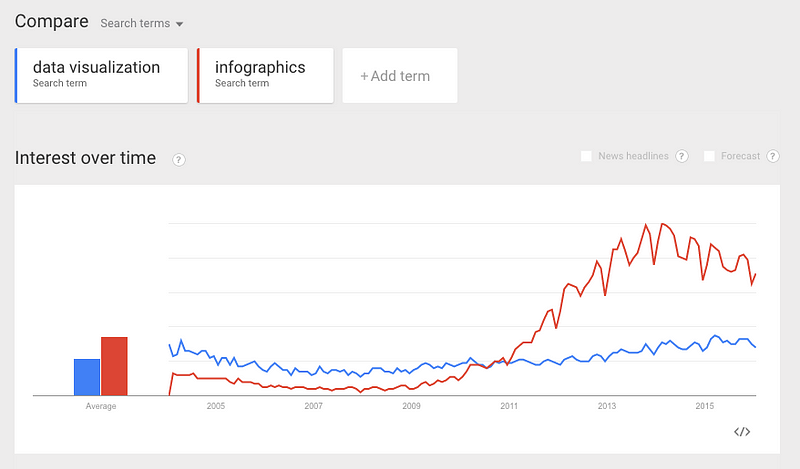
First, let’s talk about “peak dataviz” for a moment. The one and only reason I do not believe we are peaking is because I fully believe that the only effective way to communicate most data to most audiences is visually. So while we may be at or near “peak talking about dataviz”, we are still only at the beginning of a huge transition between a lot of data that is published in a non-visual (or ineffectively visualized) way and the future where (nearly) all data will be published in highly visual formats. But the conversations and excitement about the idea of data visualization (and yes, “infographics”) may have seen their moment in the sun. There will be other shiny things marketers and others will be talking about in 2016 and beyond (virtual reality, hello?)
This Field is on Fire
As I mentioned, however, the field is absolutely on fire at the moment. Let me count the ways.
- You used to see research papers on data visualization coming from very few sources and very rarely. Whereas now every time I open Twitter, I come across a new paper studying how to visualize data. I’m finding it difficult to quantify this but anecdotally, it seems as though the pace and breadth of research is increasing suddenly.
- There has been an increase in the number of university programs and positions devoted to information design and data visualization in recent years. I’ve seen existing programs grow and new ones appear. Again, this is anecdotal evidence, but I would bet that this is a measurable trend.
- The success of the graphics teams at publications like the New York Times and Washington Post, and the success of data-driven storytelling organizations like FiveThirtyEight has led to many publications building and growing their graphics teams on a massive scale. And some of them, like Quartz, are building their own tools and telling the story of their tool-building as an integral part of their ability to do their work.
- Tools are advancing and multiplying. Companies like Tableau are releasing better and more advanced versions of software that make it easier to analyze and visualize data. And they are growing like crazy. I can’t remember the last time I talked to a prospect or client who wasn’t using Tableau or considering it. On top of that, you cannot turn around without bumping into a new data visualization software package, javascript library, web app or similar being launched. Add to this, the fact that @mbostock has rededicated himself full-time to advancing D3, the defacto standard for custom interactive visualizations. I could go on an on about the explosion of tools and resources in the field.
- Books, courses, workshops, oh my. I teach courses on Lynda.com as well as via public workshops around the world. And I’ve been approached to write a book, which I want to do! I love this stuff! And I’m not alone. Dozens of books have been published (or are scheduled to be published) on data visualization, programming in various data visualization languages/packages, etc. Courses abound on all the major e-learning platforms. There is about to be (if there isn’t already) a glut of resources for learning how to do this work. For years, every new book that came out had a spin, something different, something that made it feel like it was “worth it”. While I’m sure many of the books coming out in 2016 will be interesting and unique, I’m also seeing a lot of “me-too” books that offer nothing new to the conversation. (I was afraid to be a “me-too” author, so I’m waiting for “the right book idea” before I tackle one!)
- My phone is ringing. And the incoming calls are getting more sophisticated. A few years ago, this field was largely devoted to educating audiences (depending on the vertical.) Now, almost regardless of industry, organizations realize they have data and they need to do a better job communicating (and analyzing) it, whether for internal or external use. And they realize they need help. Yet they also aren’t simply saying “We’re lost! Help us! Solve all our problems! Here’s a gazillion dollars! And then come back again next month to save us from ourselves…!!!”) No. They want outside expertise and then they want their teams to learn what they can, and be empowered with the right tools, so they can execute on this work themselves over time.
So what does this all mean?
First, it means that if you’re a data visualization practitioner, you are busyand I believe you can remain busy for quite awhile. This is not a fad. This work is not going to disappear.
However, it will be commoditized very quickly. If you’re old enough, you will remember that back in 1998, everyone wanted a website. No one knew how to build one. If you had those skills and you were a decent sales person, you could make a great living. Frontpage, Dreamweaver and other WYSIWYG editors were a disaster and there were tons of people doing that work who had no talent, no business skills, no common sense and often none of the above. What a great business opportunity! And it took a pretty long time for WordPress and Squarespace and the like to really make web design and development a true commodity. I can promise you that data visualization will be commoditized MUCH faster. Everything moves faster now and this field, in particular, is a perfect industry for software to eat. How many people need super advanced visualization or data art or other things that are hard to customize? Most just need more critical thinking, more storytelling chops, and nicer charts and graphs. Which means that if you have data and you need to communicate it well, your options are expanding rapidly and it will be easier and easier for you to do this work with fewer resources and lower budgets.
While things are moving quickly, and we’re near something that is “peak-like”, the fact is there is still a HUGE opportunity for organizations to stand out by making very small improvements to their visual communications of data. I cannot stress this enough. Most organizations are still really bad at this. Make a report that is not a wall of text with a bunch of stock charts kicked out of excel — just think strategically a bit and apply some design thinking to your data visuals and you will knock the socks off of your audience. And 2016, I believe, will be the year that more organizations will begin to do this in earnest. The hockey stick curve is still at the flat bottom toward the left for most, but it is rapidly moving upward and to the right.
Now What?
Long story short, if you have data to communicate, and you’re not sure you’re doing the best job you can, hire someone to help, or take a course or read some books and find a way to improve. You will stand head and shoulders above most of the rest. That, of course, means your content will be noticed. And it will be appreciated. But move now — 2016 is the year when everyone is getting on board. Don’t be that organization that is still doing it the “wrong” way in 2017 or 2018. It will have lasting consequences as your brand is associated with content that is difficult to understand and interact with.
If you’re a practitioner, go out and work with as many clients as you can, and teach them to help themselves. It will feel like you’re giving away future business, but trust me, it’s going to go away soon anyway. And think about what a commoditized world looks like. For instance, as web design and development have become commoditized, there are plenty of people still making a living in that field. They become tool experts, or they build plugins for those tools or they specialize in the higher-end custom work (which will always exist) or they become topic experts or they niche their focus in some other way. And that’s the key — you can be a generalist until everyone can do what you do, and then you specialize to stand out. Start finding your specialty now and you won’t be buried by the commoditization avalanche coming.