
The other day, I gave a talk about Storytelling for a corporate event. And someone came up to me afterward and said, “storytelling is the new infographics”, to mean it is the next fad in corporate communications.
I teach data visualization and infographics on Lynda.com and via data visualization workshops around the world. And I do information design & dataviz for clients as well. You could say they’re my life – and you wouldn’t be far from the truth – at least they occupy most of my professional life. So it’s a bit self-serving to say I disagree that they are a fad. Yes, they feel sort of faddish, in that they’re hot now and got very popular very quickly. And yes, something else will come along that will supplant them from the top of everyone’s mind and the lemmings will move on.
However, there is something about data visualization and infographics that goes deeper. They are not fads. Google’s defines fad as: “an intense and widely shared enthusiasm for something, especially one that is short-lived and without basis in the object’s qualities; a craze.” The key phrase there is “without basis in the object’s qualities”. That’s how I know it’s not a fad. What makes data visualization special? And why is it so important for communicators to learn this critical skill?
Infographics and data visualization are the ONLY effective way to communicate most data to most audiences. Let me say that another way. If you are communicating data to just about anyone, and you are not doing so in a visual way, you are likely wasting your time. So, um, yeah, this ain’t no fad.
You’re thinking: “OK, Bill, convince me.”
I’ll be giving a webinar on December 22 to fully convince you, but let me give you a preview.
Math is a language. Data and numbers are their own thing, separate from the language you speak. Three is. Three is not interpretable. My point is that when you communicate data and numbers in text, you are interpreting and transposing innate conceptual things into abstractions. This adds complexity, which is never a good thing for a communicator.
Maybe you struggled with math, and you don’t feel fluent in numbers. That’s OK. We can’t all be Fields-medal-winning mathematicians. The point isn’t that as a communicator, you have to be a math wiz. The point IS that you need to communicate numbers in the most accessible way to your audience, which is in its most pure form.
The easiest way I can prove this is by using a very simple example. Below is a table of numbers.
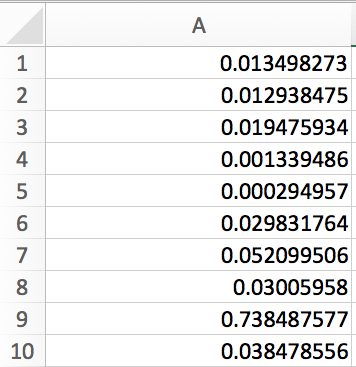
You can’t tell me what’s interesting about these numbers unless you really study the table and interpret the numbers as language and then turn it back into a mathematical explanation to then communicate. This would be true with integers but it’s even more obvious when working with numbers that are slightly more difficult for us to process like these small decimals.
But the moment I turn this text processing exercise into a visual processing exercise, you immediately see what’s interesting about this data.
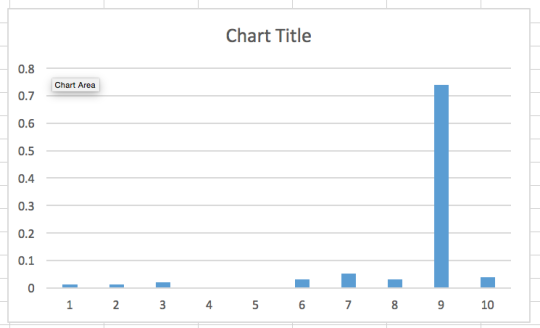
Not only do you see that one number is much larger than the others, but you see how close some of the numbers are to each other, and to what degree others are lower and higher than each other. You get the big story and much more nuance between the values.
Buy it? Great, but next you’ll say – um, yeah Bill, but I know how to make a bar chart – I do it all the time! To which I’ll say – GREAT! Bar charts are awesome! But what do you do when a bar chart won’t work? How do you take more complex data and tell a compelling story? How do you decide what story to tell with your data? This is where the real learning happens.
Come listen to my free webinar December 22 to hear some more discussion about the importance of the visual communication of data. And think about attending one of my workshops.
Oh, and by the way, I have a similar argument I make about storytelling, which is fad-like, but is absolutely, positively, not a fad. That was the basis for the talk that I mentioned at the top of this post and it’s something we talk about a lot during my workshops as well.