PUBLIC VIRTUAL SESSION: Feb 14 & 15, 2022

Join me for two half-day sessions in February. Read more below for a description.

Data Storytelling & Visualization Workshop

Learn the art and science, the theory and practical hands-on tactics of creating compelling communications experiences based on surveys, scientific research, public or proprietary data sources.

Join Bill Shander, LinkedIn Learning/Lynda.com’s data visualization expert and top-rated workshop presenter, as he walks through a curriculum specially designed for different members of your team. Space is limited (the event is restricted to about 30 people) – which means you have a lot of access to Bill’s expertise. In this very hands-on practical and intimate setting, you will get to do the work, not listen to lectures all day.

In individual and team exercises, you will work your way up from basic visual thinking exercises to creating full outlines and plans for static infographics, PowerPoint decks, and/or interactive data experiences. You will practice converting abstract ideas and data into visuals, allowing you to conceptualize and produce a complete idea that could be handed to a designer for collaboration and execution.

Swag

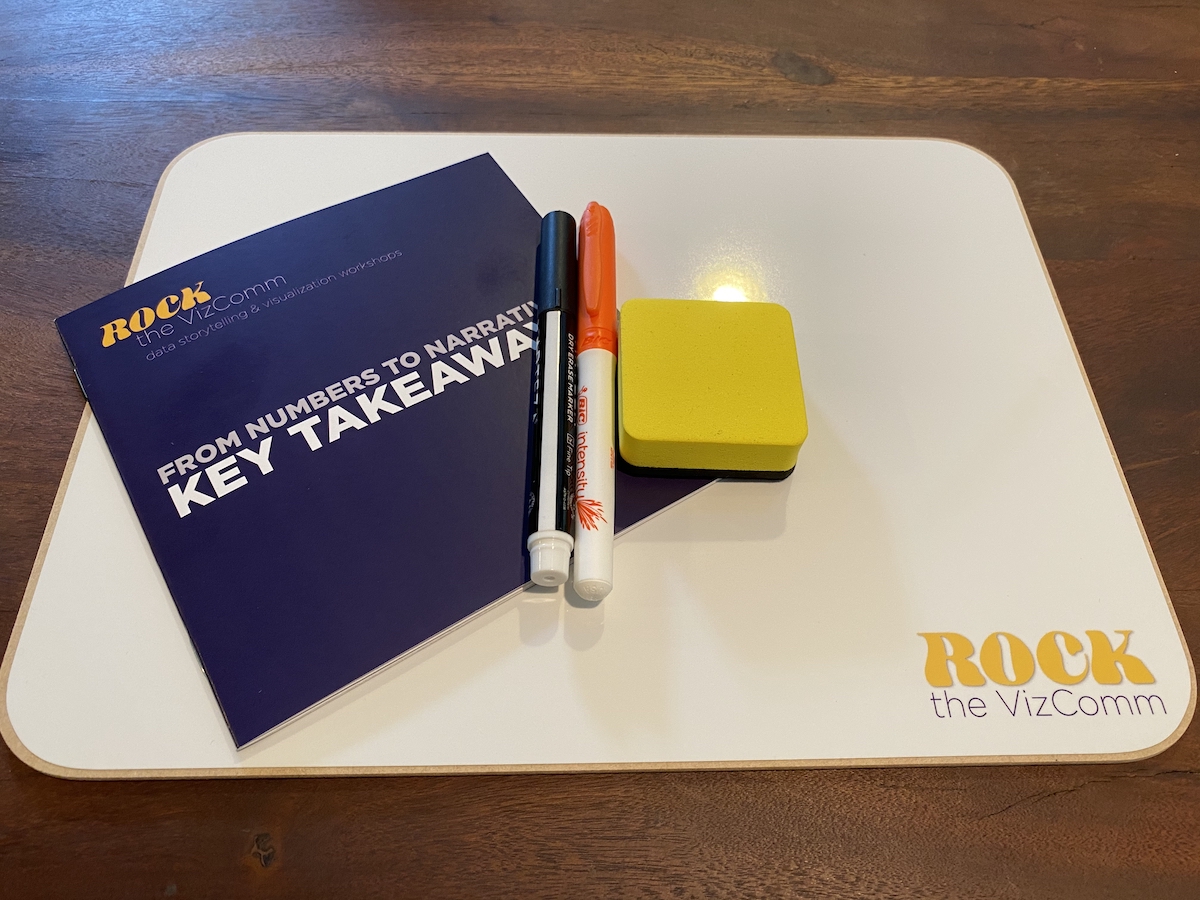
Every attendee receives a 9X12″ whiteboard, 2 markers, an eraser, and a Key Takeaways document. This isn’t really “swag”. This is an important tool to use as part of the process. There’s no way to get started visualizing anything that beats sketching by hand.

Learn

  • Strategies for creating memorable and effective data visualizations, data stories and infographics for your organization
  • How to think about data and the visual communication of data
  • Picking the right chart for your data
  • Storytelling with data
  • About information hierarchy and data visualization best practices
  • The neuroscience and psychology behind how your audience will receive your data visualizations
  • About research into best practices for data design and communications

Bill can develop custom content for your team and has available additional curriculum that can be added or swapped for the default workshop, based on your team’s specific needs.

Who Should Attend

Departments:

  • Analytics
  • Communications
  • Content Creators
  • Content Marketers
  • Designers
  • Editors
  • HR
  • IT
  • Journalists
  • Marketing
  • Public Affairs
  • Public Relations
  • And more…

From:

  • Agencies
  • Education
  • Financial Services
  • Government
  • Healthcare
  • High Tech
  • NGOs
  • Nonprofit
  • Professional Services
  • Publishing
  • Startups
  • And more…


Susan Justus – Betterment

Bill is an engaging facilitator and very knowledgeable on the topic of Data Visualization. He has a unique way of mixing the lecture with activities to make for an impactful and hands-on learning experience. He also challenged us to think outside the box by providing helpful frameworks that are tangible and easy to apply immediately.

Susan Justus
Betterment
Gretchen Hall – Strategy + Business Magazine

Bill started with a highly entertaining and informative history lesson on data visualization and then took our team through several exercises designed to give us the tools to think about our data and our content more interactively. It was an extremely successful session for us all.

Gretchen Hall
Strategy + Business Magazine
Erin Souza – Charles River Associates

Bill Shander’s data visualization workshops have been well received across all roles and levels at our firm. Bill is clearly an expert on the topic and he is also a talented facilitator! His creativity and flexibility in the classroom bode well for true problem solving.

Erin Souza
Charles River Associates
Melody Wilhelm

From the moment the team began working with Bill, our data visualizations improved, and we began to tell better stories. Bill’s relaxed style put the team at ease and helped open them up to the possibilities of using data to help tell impactful stories.

Melody Wiilhelm
Electronic Arts
Steve Smith – Knauf Insulation

I thought the session this morning was EXCELLENT!! Really useful, expertly delivered and engaging. I’ve seen quite a few talks on data visualization but this stood out and gave me things I’ll try and implement from now on.

Steve Smith
Knauf Insulation
Rachel Richter – Dun & Bradstreet

As an Analytics & Insights team at a B2B company, we are in the depths of data and analysis all of the time and can become disconnected from the needs and preferences of our audience. Bill really helped us think about how to tell a compelling story and visualize data & insights in an engaging way. He worked through specific materials with us and gave us tips & tricks that will help bring our work to a new level.

Rachel Richter
Dun & Bradstreet
Bridget D’Angelo – Nativo

Bill provided a two day training for our team of Sales, Client Success and Marketing. Not only was it fun and interactive, we all learned a lot and had many immediate ideas to implement. He tailored it to our industry making our takeaways clear and actionable. Using a mix of small group activity and larger group discussion kept us all engaged, even over Zoom. I’d highly recommend bringing in Bill and we look forward to continuing to work with him!

Bridget D'Angelo
Nativo
Heather Huerta – CALPERs

We invited Bill to come share his expertise with 24 members of public affairs and stakeholder relations teams. Bill customized a dynamic workshop specific to our needs. Bill provided a format that was engaging, educational, and inspirational. Our team is excited to put to practice his methodology and tools including his memorable acronyms for distilling messages!

Heather Huerta
California Public Employees' Retirement System
Katy Klaproth – Robins & Morton

Bill’s infographics workshop was tailored to my company and team’s needs, allowing us to develop infographics that will be used on presentations in the future. I would highly recommend this training to anyone looking for a way to tell their story in a visually impactful way!

Katy Klaproth
Robins & Morton
Jenny Rone – US Department of Agriculture

Bill’s class inspired my staff. For example, he effectively led a critique of some draft visualizations, provided pointers, and walked the staff through a ‘before and after’ demo. That “real life” activity, in particular, has helped challenge the staff’s creative thinking and transformed their process and deliverables. It was tons of fun!

Jenny Rone
US Department of Agriculture
Joe Procopio – International Monetary Fund

Bill Shander’s workshop was perhaps the most highly praised workshop our department’s staff training committee organized this year. Bill was happy to work closely with us before the workshop to help tailor its contents to make it more relevant for our organization’s communications objectives and staff’s current skill level. Everyone left the day energized and more confident in their ability to tackle future data visualization projects.

Joe Procopio
International Monetary Fund
Kristina Gubanov

This was one of the best if not the best learning sessions I’ve seen at IX – immediate gains in my view and I already find myself adjusting how I present my data and I am sure others are as well.

Kristina Gubanov
Index Exchange
Brian Rus – Acxiom

Bill led our analytics team through a full day virtual data storytelling workshop and did a fantastic job! There was excitement and energy throughout the day with the use breakout rooms and exercises to keep us engaged. Our team has a wide range of data visualization experience and everyone was able to contribute and learn in a collaborative environment. Bill kept the conversation friendly yet productive, and we received outstanding reviews from attendees after the event. I would recommend this workshop for any team that works with data.

Brian Rus
Acxiom

Research-Driven Best Practices

These workshops aren’t made up of just Bill’s opinions on design and visualization. They’re backed up by decades of academic research by the top minds in the field.