D3.JS Key Concepts Workshop
D3 has become the standard tool for creating custom, interactive, animated visualizations for the web. This open-source Javascript library has a very active community, is in constant development, and is very easy to learn for those well-versed in Javascript, HTML, CSS, and SVG or Canvas.
In this workshop, participants will be introduced to the most critical key concepts in D3 that, once learned, will allow them to continue their learning journey well-versed in the most commonly used core features, making it easier to pick up further knowledge at their own pace.
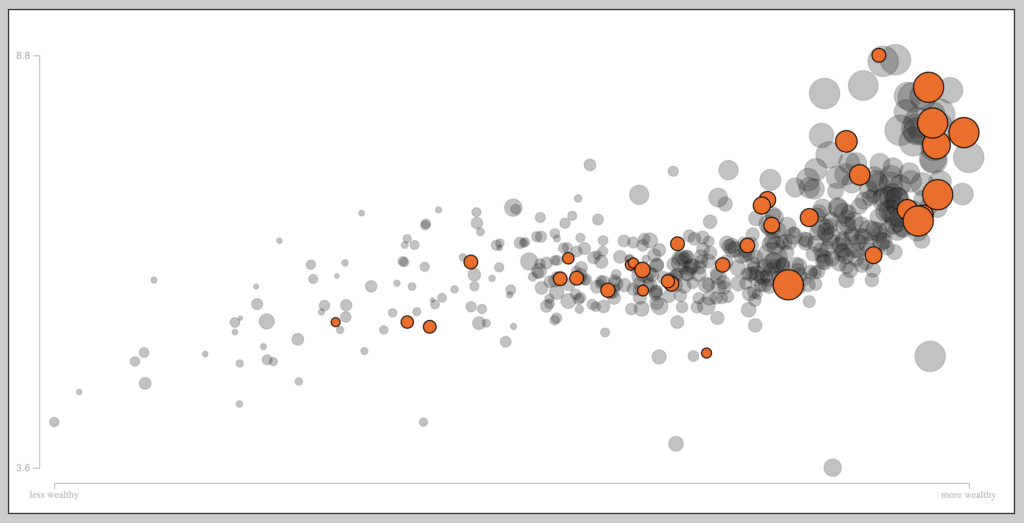
We will do this by building an animated, interactive scatter plot during the first half of the day. This step by step process will result in a fully functional data visualization that requires learning multiple key skills in D3 that will be translatable for future projects.
Learn
- The basics about SVG elements
- Creating data-driven graphics
- Using D3’s built-in scales
- Using D3’s built-in axes
- Adding animation
- Adding interactivity
- Creating maps in D3
- Creating circular graphics (like pie and donut charts) in D3
- Creating force-directed graphs in D3
Who’s It For
- People who know some Javascript (experts don’t need this course, total noobs may struggle to follow along, but if you know even just a tiny bit, this course will work for you)
- People who want to know how to create custom, animated, interactive visualizations for the web


