Who Says Data Visualization Should be Beautiful?

I’ve said this a million times and I’ll say it again: aesthetics matter. Making things beautiful is not superfluous. It can make the difference between a visual that hopefully contains insights and something that actually engages an audience, inspires them to take action, and helps them really remember the data being shared.
Data Visualization is Not a Technical or Left-Brain Task

I fundamentally disagree with the image used to illustrate this article. And I chose it! I’m picking a fight with myself! Charts don’t belong exclusively in the left brain. They are NOT a left-brain task.
What does a bento box have to do with data visualization?

Have you ever eaten a meal where the entire experience was just a failure? Maybe you waited a long time to sit down, the waiter was rude, the food took forever, it came on a floppy paper plate, the table was dirty, and the ketchup had that crusty dried glop blocking the spout? Yuck. Not […]
Data is not the Truth

Data is not the Truth. Data is not objective. Data is not the end-all be-all solution to all of our problems. But first and foremost, I’ll say it again. Data is not the truth.
Sure, Concepts Lead to Visuals…but It’s Really a Two-Way Street

When you’re creating a visual representation of anything, the thing you’re representing is, by definition, where you have to start. You can’t make a visual unless you know the subject. Duh. BUT…
What the Trump Indictment, ChatGPT, and Rick Astley All Have in Common

Made you look! See the power of a great headline to turn heads? Actually, in this case, this could be a terrible headline. Personally, I’m so sick of headlines about ChatGPT and Trump that I’m more likely to ignore this than to actually click through. See the power of a bad headline to turn people […]
Do You Suffer from Xenographobia?

Every data visualization starts its life as a “xenographic”, which means a strange unfamiliar graphic that might be confusing, intimidating, maybe even scary.
Couch to Viz, Baby!

If you’ve ever run a marathon, you might be familiar with a “couch to marathon” training program. The idea is that you can go from being a total couch potato to running a marathon in a relatively short time (16-20 weeks) if you follow a prescribed training plan.
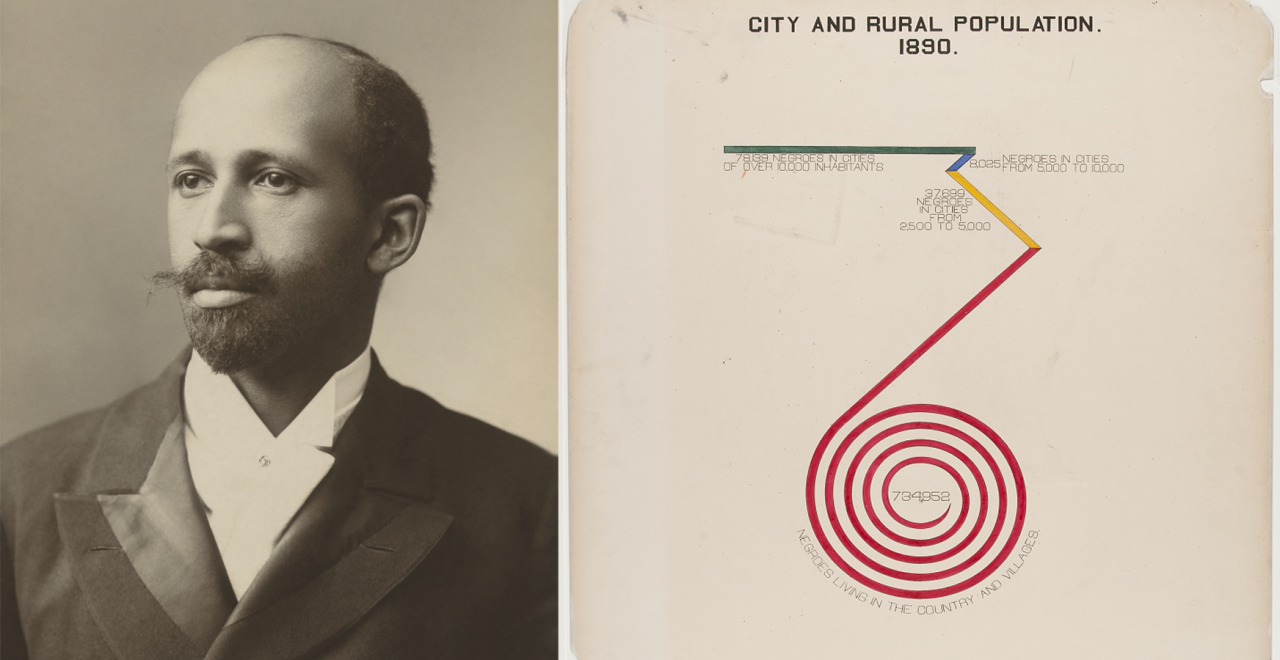
W.E.B. Du Bois: DataViz Legend

One of the most important figures in African American history is W.E.B. Du Bois. He was the first African American to receive a PhD from Harvard, he cofounded the NAACP, he wrote very influential books about the African American experience and was a widely regarded intellectual and activist.
PhotoViz? Photography is (can be) DataViz. Yup.

I am regularly asked “what is data visualization, exactly”? And my answer is very simple (and I may have stolen this from someone else…but it’s so simple and clear I can’t be sure where it came from, if not my own brain!) I say “dataviz is the presentation of data in a visual format”, which […]
