Data Visualization is Not a Technical or Left-Brain Task
I fundamentally disagree with the image used to illustrate this article. And I chose it! I’m picking a fight with myself! Charts don’t belong exclusively in the left brain. They are NOT a left-brain task.
What does a bento box have to do with data visualization?

Have you ever eaten a meal where the entire experience was just a failure? Maybe you waited a long time to sit down, the waiter was rude, the food took forever, it came on a floppy paper plate, the table was dirty, and the ketchup had that crusty dried glop blocking the spout? Yuck. Not […]
Data is not the Truth

Data is not the Truth. Data is not objective. Data is not the end-all be-all solution to all of our problems. But first and foremost, I’ll say it again. Data is not the truth.
Sure, Concepts Lead to Visuals…but It’s Really a Two-Way Street

When you’re creating a visual representation of anything, the thing you’re representing is, by definition, where you have to start. You can’t make a visual unless you know the subject. Duh. BUT…
What the Trump Indictment, ChatGPT, and Rick Astley All Have in Common

Made you look! See the power of a great headline to turn heads? Actually, in this case, this could be a terrible headline. Personally, I’m so sick of headlines about ChatGPT and Trump that I’m more likely to ignore this than to actually click through. See the power of a bad headline to turn people […]
Do You Suffer from Xenographobia?
Every data visualization starts its life as a “xenographic”, which means a strange unfamiliar graphic that might be confusing, intimidating, maybe even scary.
Couch to Viz, Baby!

If you’ve ever run a marathon, you might be familiar with a “couch to marathon” training program. The idea is that you can go from being a total couch potato to running a marathon in a relatively short time (16-20 weeks) if you follow a prescribed training plan.
W.E.B. Du Bois: DataViz Legend
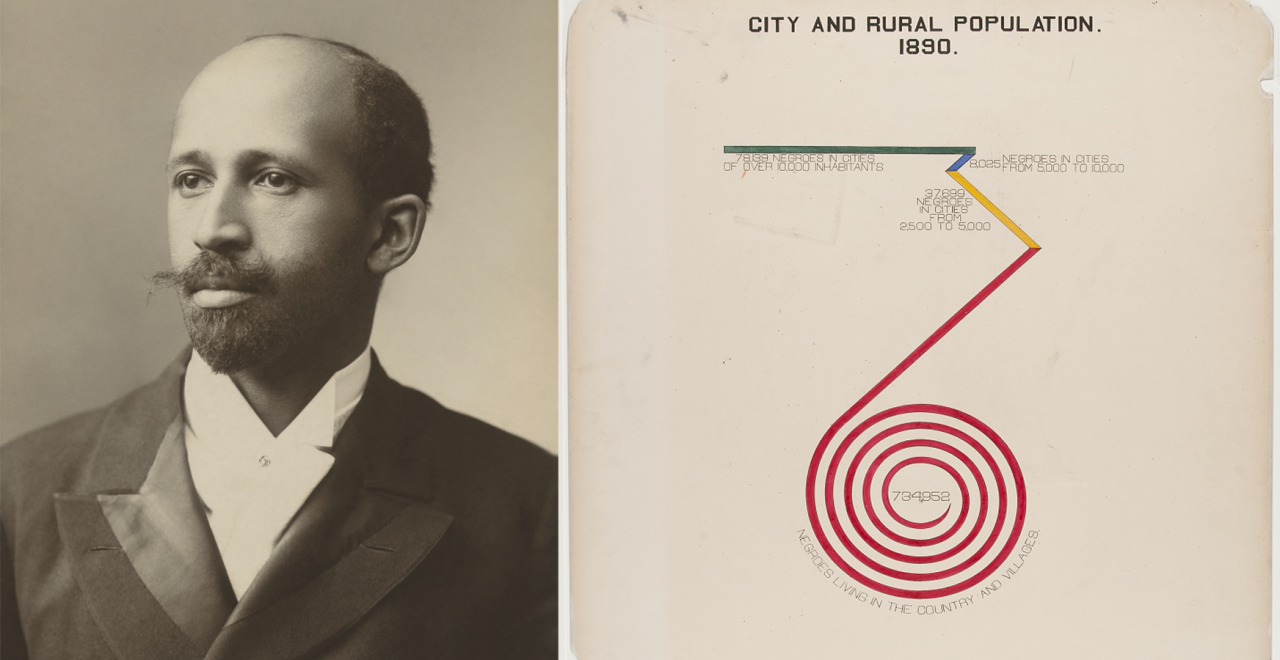
One of the most important figures in African American history is W.E.B. Du Bois. He was the first African American to receive a PhD from Harvard, he cofounded the NAACP, he wrote very influential books about the African American experience and was a widely regarded intellectual and activist.
PhotoViz? Photography is (can be) DataViz. Yup.

I am regularly asked “what is data visualization, exactly”? And my answer is very simple (and I may have stolen this from someone else…but it’s so simple and clear I can’t be sure where it came from, if not my own brain!) I say “dataviz is the presentation of data in a visual format”, which […]
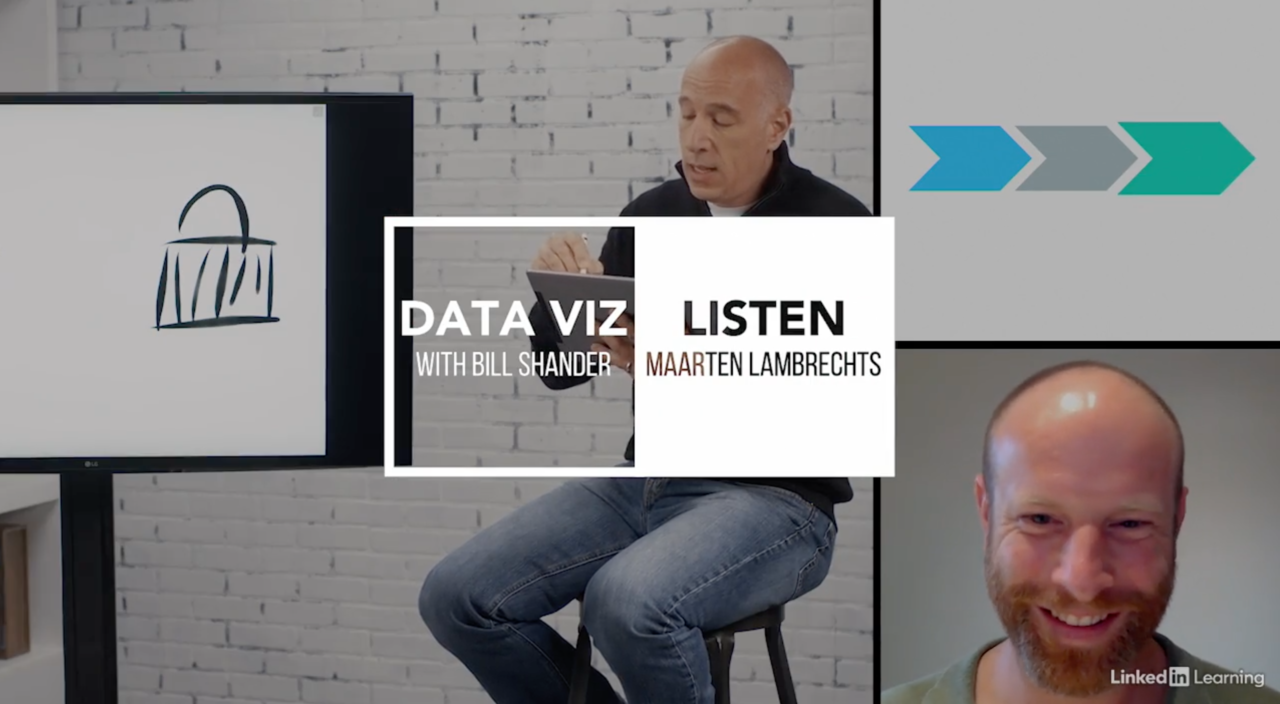
Data Journalism Is Where It’s At (mic drop)
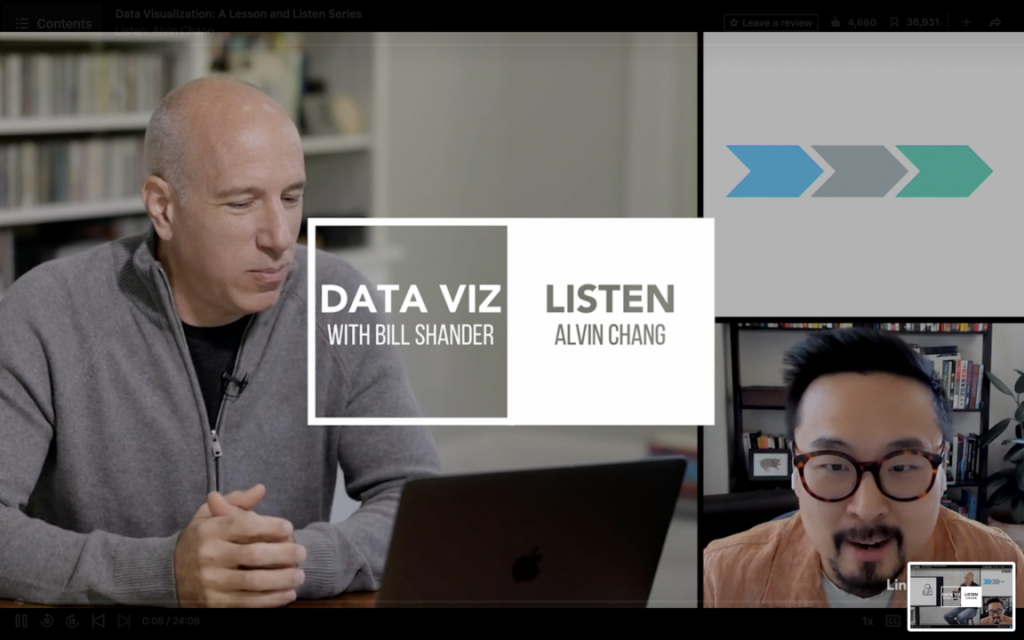
The headline says it all, kinda. Watch the episode for plenty more nuance in the conversation around data journalism: why it is doing the best work in the field, where the gaps and concerns are, where it’s going, and how this all relates to the work “normal people like you” (non-journalists) are doing.